Polars, Marimo, and the Joy of Personal Finance
Something that impressed me this last week is the buzz surrounding a new Python framework called Polars. It has been touted as the successor to Pandas, boasting a better API and significantly faster performance. Plus, it’s written in Rust, which always draws attention nowadays—though who knows if that “shiny object” syndrome might backfire in the future. Regardless, I’ve been looking for an opportunity to use it, and I finally found a “real-world” itch to scratch.
We all love to dive into personal finances with spreadsheets and code, don’t we? Well, no—most people don’t. If you’re my wife, you definitely don’t want to get too far into the weeds. She’s perfectly happy with a simple app on her phone that tracks transactions and tells her if we can spend more or less. But I’m a bit more involved. I’ve been tracking our finances at the end of every month for the last four or five years.
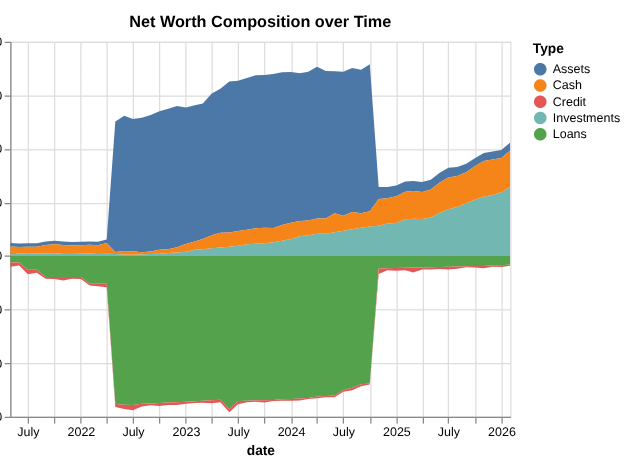
My process is simple: once a month, I check all our accounts and enter the balances—positive, negative, debit, credit, checking, or loans—into a spreadsheet. It works well, but I’ve always known I could put more effort into creating better visualizations. This was the perfect chance to try out Polars.
The Modern Python Ecosystem
The first thing that struck me was how much the Python ecosystem has improved. If you’re using uv, the experience of installing packages or dealing with version updates is incredibly fast.
The second realization was that I never really knew the Pandas API. I remember it being tricky; you always felt like you were fighting to get back to your mental model of rows and columns. I used Pandas heavily during university because it was the go-to for data processing. After all, if you’re given a CSV, why would you ever want to process it by hand?
Shifting to Polars
Polars was a little trickier at first because it leans into functional programming. The idea of piping data through transformations is much more prevalent. While I love the concept, looking at the API felt tough for the first hour or two. However, once it clicked, I grew to love it.
I especially appreciated the renamed APIs. For example, while the melt API from Pandas still exists, Polars gives you a deprecation warning suggesting the unpivot function instead. It’s such a thoughtful detail. I’ve always found the melt terminology in Pandas a bit abstract—it’s one of those terms you have to “translate” in your head every time you use it. Switching to unpivot feels like the API finally caught up to how I actually think about data; I’m not “melting” something into a puddle, I’m literally reversing a pivot to get my months back into a clean, searchable column.
The Transformation
My approach was to read in the CSV, filter out aggregations or stray cells with random text, and extract the raw data. The original spreadsheet was in a “wide” format—months along the X-axis and account names down the Y-axis. Using a mix of filtering and regex parsing, I converted it into a “narrow” format that data processing systems prefer.
df = pl.read_csv(csv_file)
df = df.filter(pl.col('Type').is_not_null() & pl.col('Account').is_not_null())

df_narrow = df.unpivot(
    on=date_columns,
    index=['Type', 'Account'],
    variable_name='date',
    value_name='amount'
)

df_narrow = (
    df_narrow
    .filter(pl.col("amount").str.strip_chars() != "-")
    .with_columns(
        # 1. Clean and cast to Decimal
        pl.col('amount')
        .str.replace_all(r'[$\s,\(\)]', '')
        .cast(pl.Decimal(precision=None, scale=2), strict=False)
        .fill_null(0),

        # 2. Parse the date
        pl.col('date').str.to_date('%m/%d/%Y')
    )
    .with_columns(
        # 3. Flip the sign for Credit or Loan types
        pl.when(pl.col("Type").is_in(["Credit", "Loans"]))
        .then(pl.col("amount") * -1)
        .otherwise(pl.col("amount"))
        .alias("amount")
    )
)
Enter Marimo: A Better Notebook
The most fun I had was working with Marimo, a reactive notebook that serves as a replacement for Jupyter.
I’ve always found Jupyter notebooks frustrating to share. When a data scientist sends you a notebook, it often requires specific inputs and breaks on the first run because the cell execution order is messy.
Marimo fixes this by:
- Outputting a pure Python file: It uses decorators like
@app.cellto turn every cell into a function. - Reactivity: It builds a dependency graph behind the scenes. When you change an input, it automatically reruns only the downstream cells.
- UI Elements: It has built-in sliders, date ranges, and buttons that make it feel like a web app rather than a static document.
The result? Beautiful, instantly updated dashboards that are actually presentable to a manager or coworker.
| Feature | The “Old” Way (Pandas/Jupyter) | The “Modern” Way (Polars/Marimo/uv) |
| Execution | Eager (calculates every step immediately) | Lazy (optimizes the whole plan before running) |
| Speed | Single-threaded (uses 1 CPU core) | Multi-threaded (uses all available cores) |
| Language | Python / C | Rust (high performance & memory safety) |
| Notebook Format | .ipynb (Messy JSON files) |
.py (Clean, versionable Python scripts) |
| State | Hidden (out-of-order cells can break code) | Reactive (updates downstream cells automatically) |
| Package Mgmt | pip / conda (can be slow/bloated) | uv (extremely fast, lightweight, and modern) |
So I’m convinced that going forward my go to data stack is polars, uv, and marimo. If I was actually cunching some large data, and not just a pet project for personal finances, I’d start reaching also for DuckDB as a way to reach and store my data in memory or as another alternative to polars.